
Jump to…
Detailed Current Conditions
Interactive Weather Map
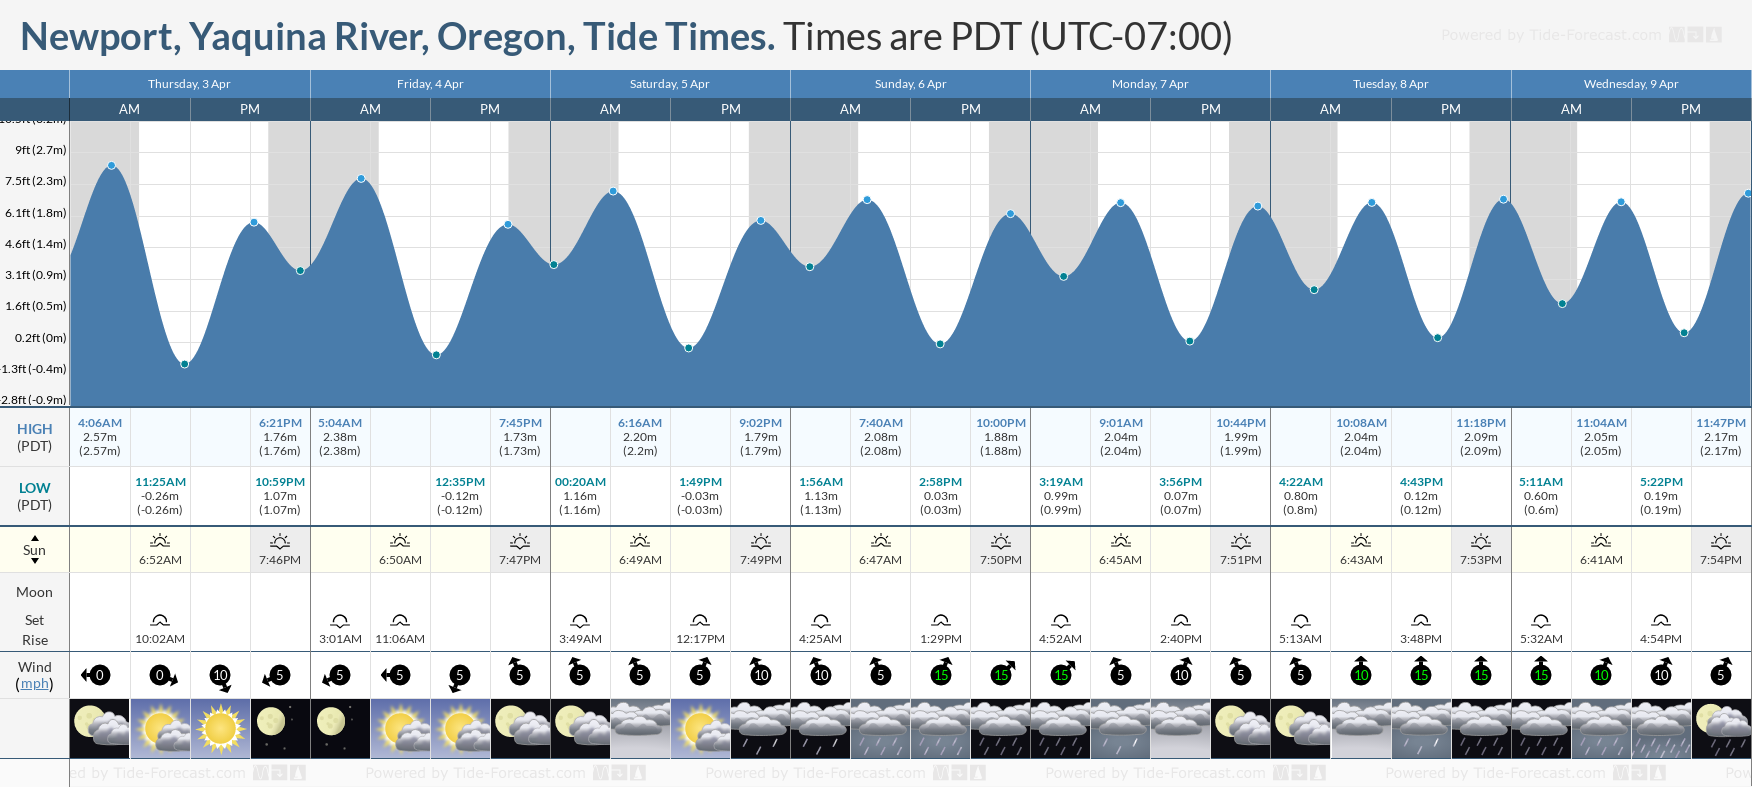
Tide Table for Yaquina Bay
GOES-West – Pacific Northwest Satellite Imagery
GeoColor – True Color daytime, multispectral IR at night

Air Mass – RGB composite based on the data from IR and Wv

Band 8 – 6.2 µm – Upper-Level Water Vapor – IR

Band 7 – 3.9 µm – Shortwave Window – Ir

ODOT Yaquina Bay Bridge Webcam

Recent Earthquakes List
Weather warnings provided by WillyWeather.
https://www.willyweather.com/